A new Meetup session – all about the monitoring

Monitoring, monitoring, monitoring

Thursday, May 19, 2016, 6:30 PM

Campus TLV
Yigal Alon 98,Electra tower, 34th floor Tel Aviv-Yafo, IL

14 Spiders in the Web Attending

This meetup is a joint event with Devops-in-Israel  group and is all about Monitoring! We have two great speakers who will talk about their views on when and how to monitor your infrastructure. Don’t forget to invite your developer friends, as they will find it interesting as well.1. Monitoring – When to start? by Assaf FlattoOpen source monito…

Check out this Meetup →

Icinga Berlin camp 2016

After a long wait, and many failed attempts to get to an Icinga event, I finally am able to attend the icinga Berlin camp, arriving early the main lecture hall is vacant

image


and the reception hall is stating to fill up.

image


The front counter stuff was very friendly and helpful.

image


After the initial orientation and saying hello to the team members we moved to network and mingle with the crowd, most speaking German but there was a presence of Italians, English, Netherland and a Syrian.

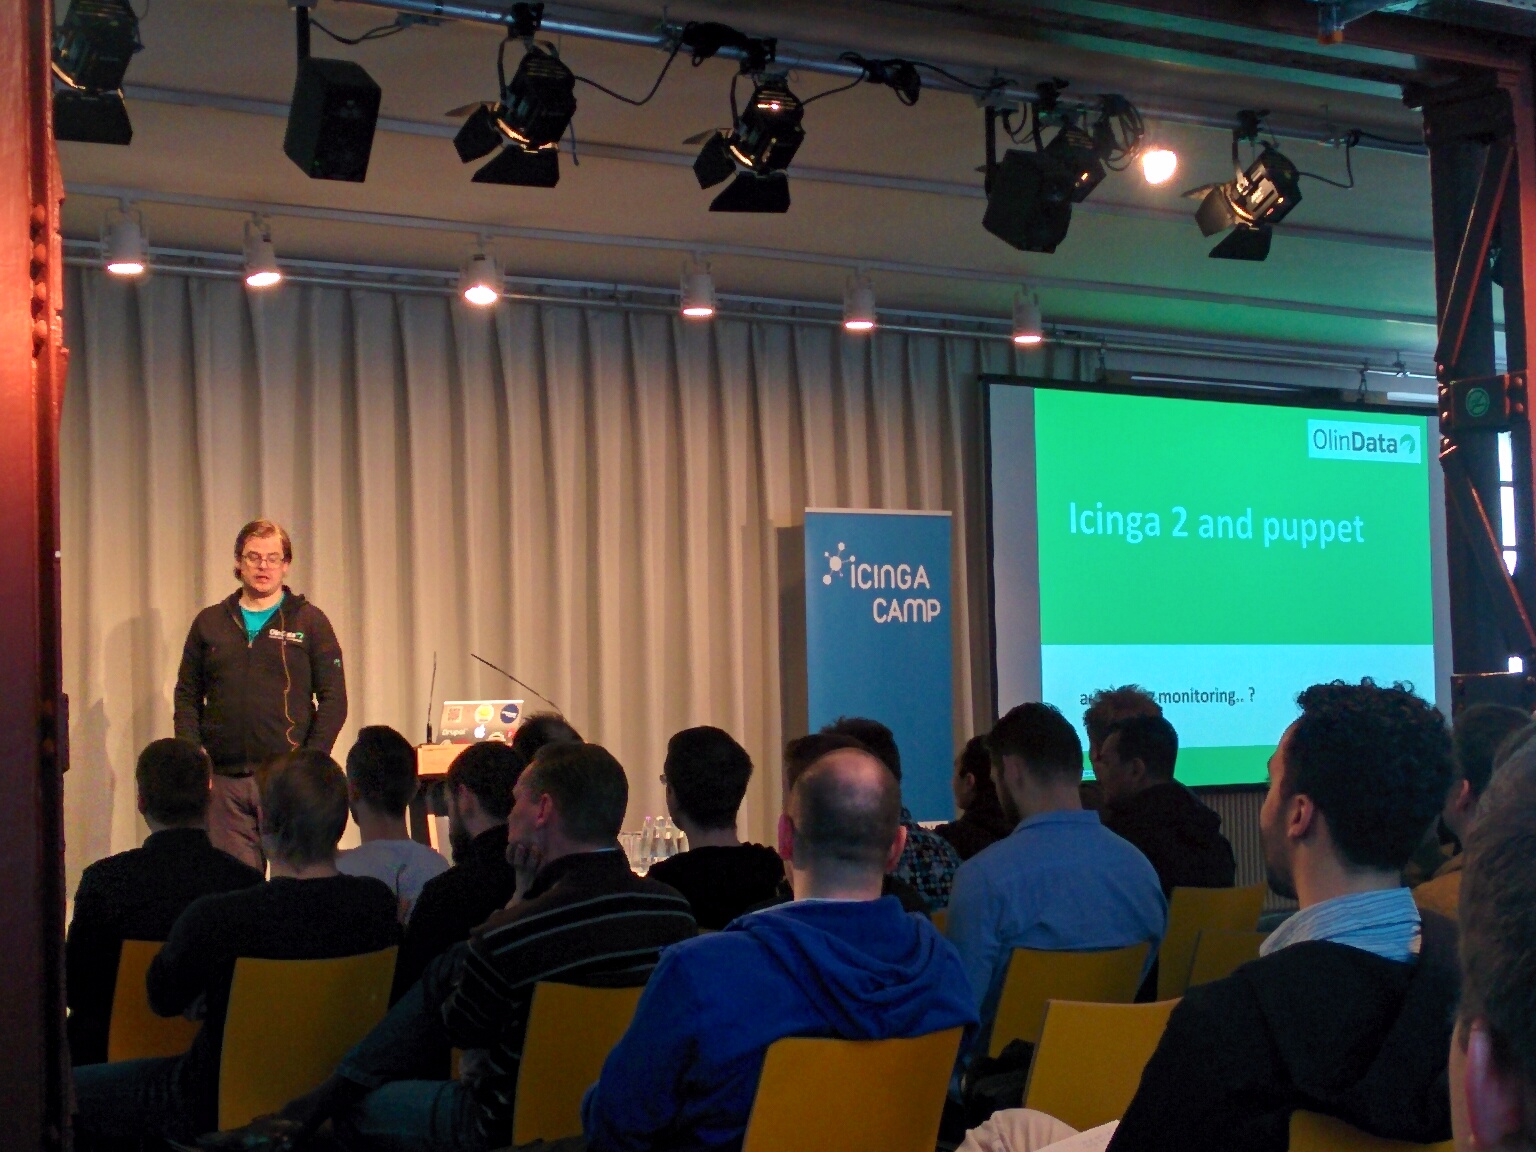
The Guys from OlinData presented the smooth and powerful way that Icinga2 can and does incorporate with Puppet  and how you use the Manisent they published for it, and also on how you can expand the functionality.
image


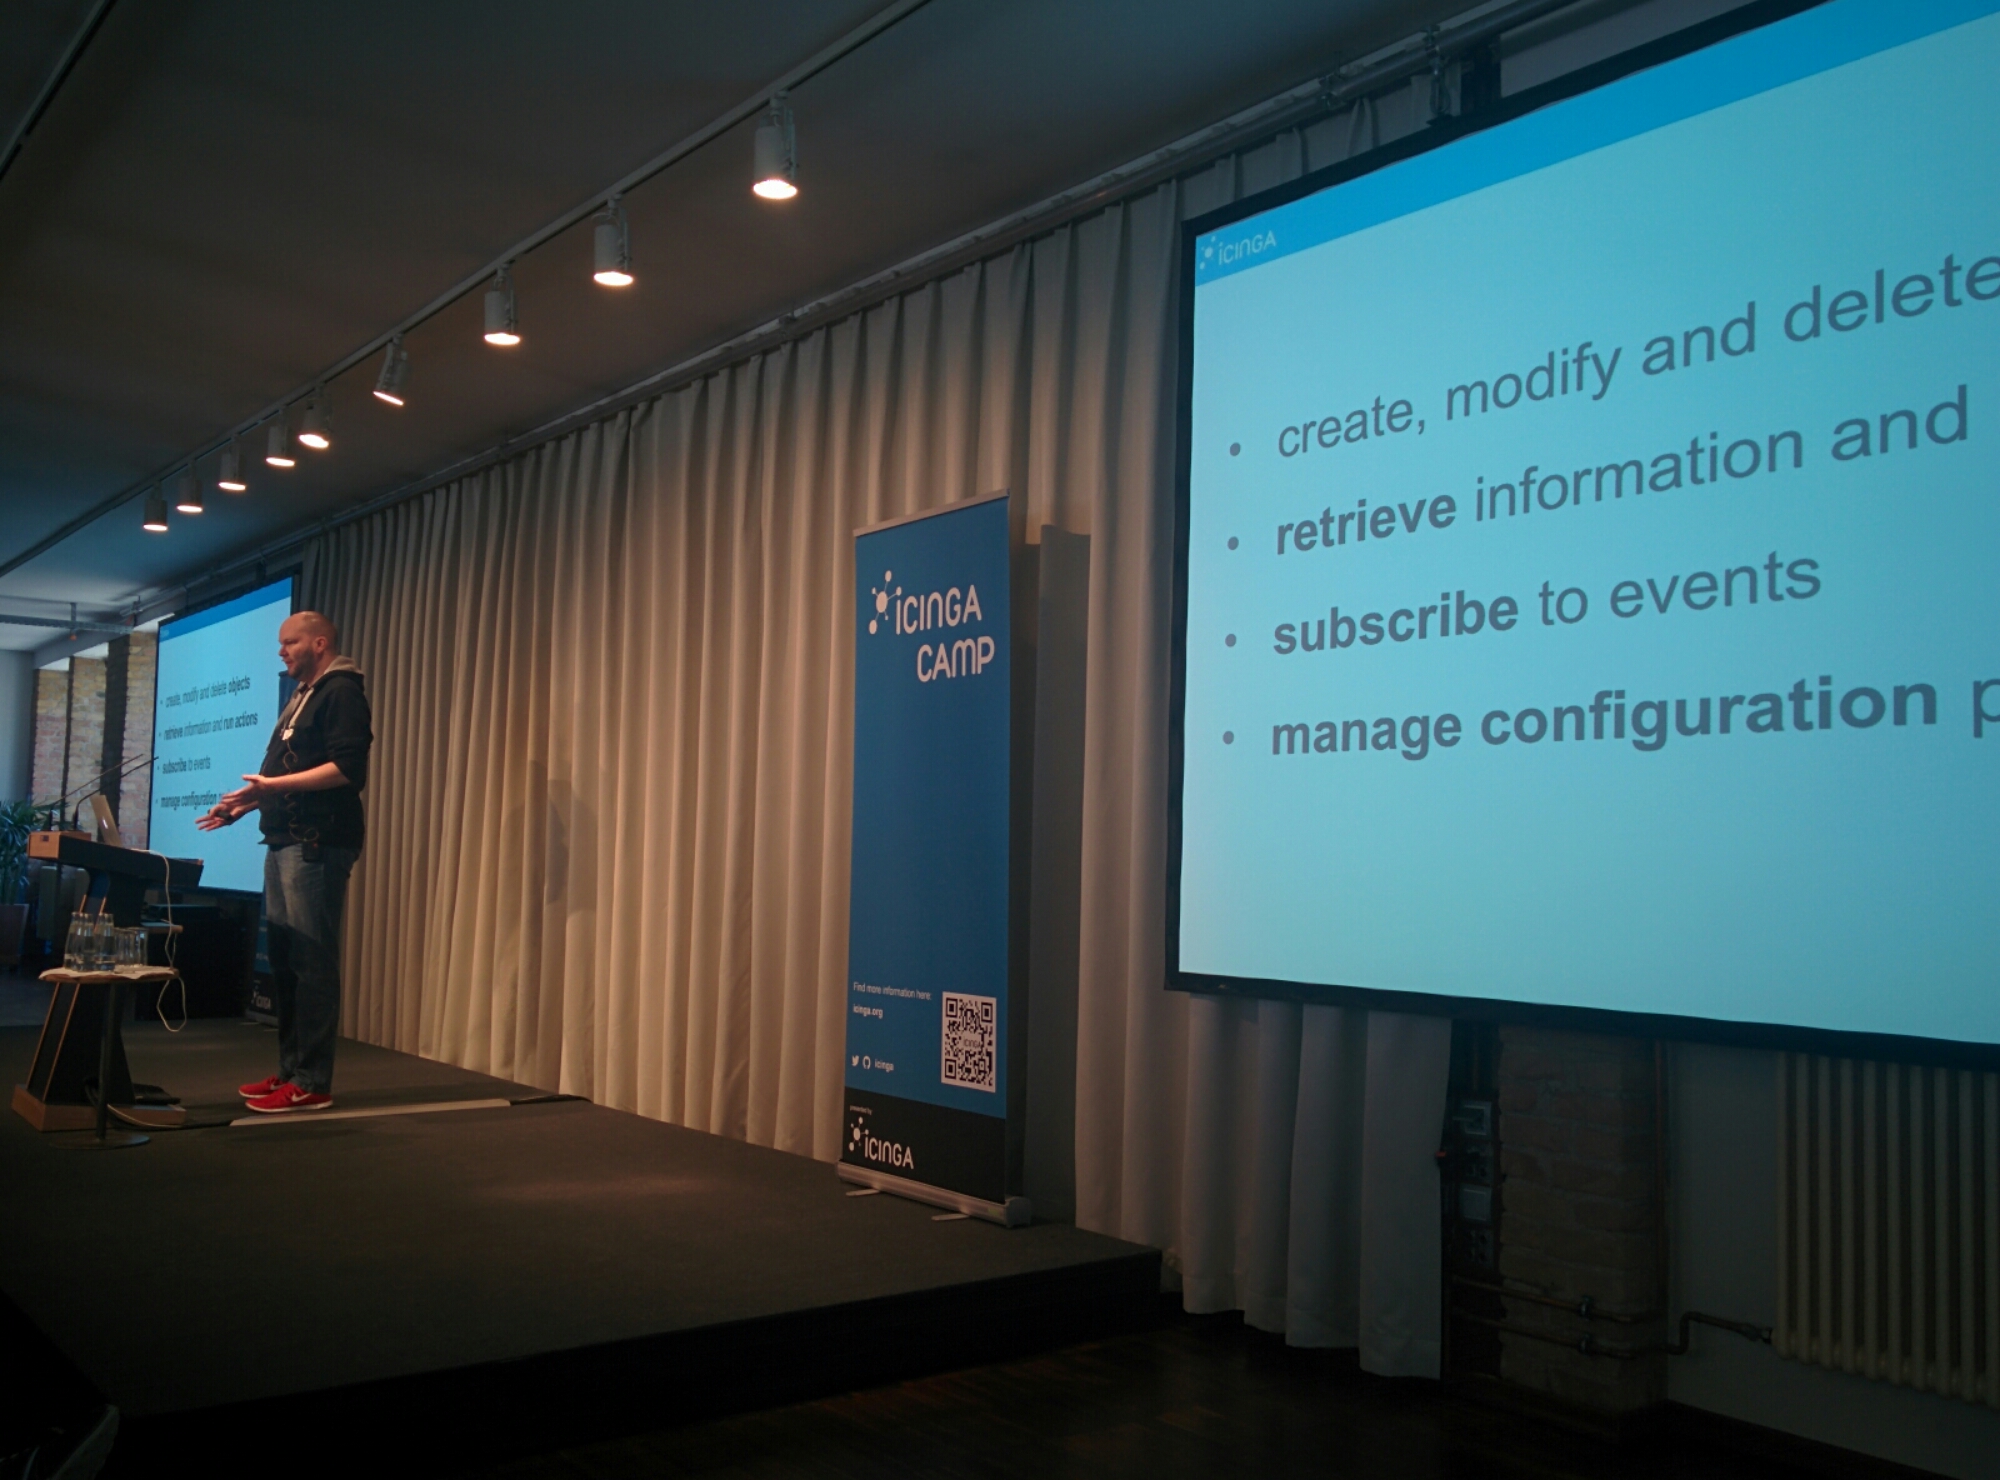
@dnsmichi (core developer for Icinga) gave a facinating presentation that (as is usually the case i have been told) ran over the alloted time about the Icinga2 API , showing the improvements and featrures that came and were added.
image

One of the things that many users have asked for in Icinga is the ability to configure the system from a WebUI , and in this talk is was announded , the Icinga Director, which is a Icinga2 Web module and enables the user to define and configure Icinga with all the regular functionality that you can do with the configuration files.

It is an “add-on” module, meaning it does not come pre-bundled in the Icinga2 Web, but you can add it when and if you want it.

image

There were other talks, some less interesting to the general , but one that realy was of interest to me was how a university is using Icinga2 to monitor training labs in the courses it is giving, it is able to connect to virtual boxes and determine the status of the task the student is running and inform the teacher of it’s progress. This is something both Training Partners present showed interest in as it can be used in our training courses for the “hands-on  labs”.


After event dinner and Beer

image

All the presentation are avilable on the Icinga Camp archive.

We talked about doing another Camp in a European city in the near future and I am hoping to prestent a talk of my own.

Icinga: from stand-alone to Cloud oriented evolution

When you start talking to System Administrators, DevOps engineers, Developers or NOC personal about open source NMS* tools, the first one that comes to mind is Nagios®. When you tell them that Icinga is a fork of Nagios, they are quick to dismiss it too, due to the reputation that Nagios carries with it.

Icinga owes its origin to Nagios’ limitations. It started as a fork from the Nagios code, and as such was encumbered with the limitation of the original design: Classic Data Centre computing – bare metal and manual management, but it evolved to something quite different.

Icinga was born due to the slow progress of the Nagios project in response to requests made by the community and the inability of that same community to contribute, send updates and improvements upstream to the core product. Wanting to allow the community to have its say, Icinga started by asking for improvement ideas. Many improvements were added to the Icinga code but the main request that was coming back from users was: redundancy and adaptability.

Creative solutions thought of: integrations with CMDBs, active-passive fail-over with data syncing etc. but none of those truly solved the inherent problem that was in Nagios – centralized standalone box that required constant updating to keep up with new servers or services.

The Icinga team knew they had to adapt the project to the Cloud frame of thought and mode of adaptability. Thus Icinga2 and the Icinga2 API were conceived and developed. Icinga2 was designed from the ground up, forgoing the old code base and starting from a fresh view. Some principals were brought over (hosts, services, hostgroups, servicegroups and dependencies) but the approach to those concepts was altered:

  • The configuration scheme was changed to become a configuration DSL which allows quasi-code to be incorporated in the definition and includes conditional logic for improve dynamic adaptation to the actions taken.

  • While the old classic UI works seamlessly with the new engine, a new Web2.0 User Interface (titled Icinga2 Web2) was designed, and includes the capabilities to incorporate other tools that expand the monitoring exposure to the Dashboard, like ELK* stack, Graphite, Nagvis and PNP4Nagios.

  • Icinga2 comes with a truly distributed solution that allows monitoring in geographically separated zones to sync and transfer HA capability for redundancy, which is supported by a SSL based communication to increase the security of the data transferred between nodes.

  • Icinga2 API is a fully fledged REST API that allows registration and configuration of nodes and services at run time without the need to modify configuration files or restart the main process for the systems to be monitored or be removed (for example: when a cloud instance goes off-line).

  • Icinga1 was available as a preconfigured VM* image to those that wanted to test and learn how to use the system. Moving along with the times, Icinga2 comes in other ways that are easier and faster to adopt and deploy: Docker & Vagrant. The Icinga team also provides a ready to use play-books/recipes/manifests for the most popular configuration tools: Puppet, Chef and Ansible.

If you are looking to learn about how implement Icinga2 into your organization, all those developments and more topics are covered in the official training courses provided by Icinga training partners, like Aiki Linux Ltd.

Glossary:

NMS = Network Monitoring System, a software tool that enables querying the state of the nodes that exist in the company’s infrastructure (local & remote).

ELK = ElasticSearch, LogStash & Kibana stack, a combination of software tools that allows collection and aggregation of logs and data for analysis and study.

CMDB = Configuration Management Database 

New Offices

We are proud to announce the opening of our new branch and offices in Israel.

After a continuous deliberations and consideration we have decided to open a branch in Israel to spread our growing presence and be able to provide better services in the region.

Elastic search and Logstash or Dev driven infrastrucure

In the past couple of weeks I have been working on implementing an elasticsearch solution, combined with logstash we hope to implement it to replace the existing Splunk system that exist within the infrastructure.

I have build a Chef cookbook to implement it, and with in the confines of the testing it worked,  then one of the developers “complained” that there is a newer version and as they use it in their environment we should use it too.

Suffice to say that I had to spend the entire day trying to fix it in the system we are attempting to have in production, only to eventually learn that the versions are incompatible for the method we want to use and then I had to roll back all the version and re-apply the system.

In many places I have witnessed a mentality were the developers are setting the standard policy on tools and implementation – which more often then not usually backfires when the lead developer leaves or a system admin gets “dumped” with a tool and is expected to know it from day 1, and when it breaks, no one asked the developers anything and the blame falls on the ops person.


So today when the developer put his input about upgrading the component that was incompatible, instead of rolling back to a version we know that works, I told him flat out – No, and only when we System decide we want to upgrade – we will do it – not on their wishes.

Chef, Git and Ruby

In the last month I have been working on building chef configuration for deployment and management of the infrastructure of the current client,it is a very complex setting for an ISP and many bespoke setting and applications so using any existing chef recipes will need to be modified heavily that we are creating them from the start.

The choice of Git as a version control system was dictated by the development team and the more I work with it the more I learn to HATE it, it is full of features to a  point that it is becoming annoying and when you want to drop a section and move to work on something else it twists your arm to act in a specific way that I find upsetting.

Chef and ruby I am getting learning to accept and  becoming competent in their use , so much so that a project I was planning to work on in Puppet initially , I am now contemplating to migrate to Chef.

Talking to the API

In many environments I find myself “teaching” employees how to work with a monitoring system: why nagios is sending more then one alert , why they were unable to acknowledge an issue , why they did not get a notification about an event they saw on the dashboard , what the benefit of the scheduled downtime is , and many other things that come with working with nagios.

Almost always the question comes up “is there an automated way we can have to do all those things ?” , well, the answer to this is always “Yes , and No” .

Yes – there is the External commands that are available to communicate with the nagios core process and allow you to submit actions without using the Web Ui .

No – to each command there are somewhat different parameters and you will need to know which ones need to be added for which command , otherwise the request will fail .

So I have been working on trying to allow the user to “simplify” the access to the cgi and wrote a script :

#!/bin/bash

usage (){
echo “usage :sumbit_cgi_option.sh <Host> <Service> <Comment>  <username> <password> <cmd_mod> ”
echo -e -n “The script requires several parameters in order to work :\n”
echo -e -n “\tHost = The short hostname [i.e lmmapp2801].\n”
echo -e -n “\tService = The descriptive service name  [i.e Jave Core Dump], a name containing spaces should be encapsulated in single quotes ‘ ‘ .\n”
echo -e -n “\tComment = A descriptive comment pretainig to the issue. \n”
echo -e -n “\tUsername  = Your Nagios interface login name. \n”
echo -e -n “\tPassword = Your Nagios Interface password.\n”
echo -e -n “\tcmd_mod = should the command run on a host level or a service level :\n”
echo -e -n ” \t\t2 = Service Level (Prefered Method)\n”
echo -e -n ” \t\t1 = Host Level \n”
}

type_host () {
echo -e -n ” CMD_ADD_HOST_COMMENT\t                            1\n”
echo -e -n ” CMD_SCHEDULE_HOST_DOWNTIME        \t              55\n”
}
type_svc(){
echo -n -e ” CMD_ADD_SVC_COMMENT\t                              3\n”
echo -n -e ” CMD_SCHEDULE_SVC_DOWNTIME          \t             56\n”
echo -n -e ” CMD_SCHEDULE_HOST_SVC_DOWNTIME \t                 86\n”
}

if [ $# -ne  6 ] || [ $# -eq 0 ] ;then
usage
exit 1
fi

HOST=$1
SERVICE=$2
COMMENT=$3
NAGURL=http://10.173.4.82/nagios/cgi-bin/cmd.cgi
USER=$4
PASS=$5
CMD_MOD=$6

echo Scheduling downtime on nagios

if [ $6 -eq “1” ] ; then
echo “Enter the Host command type:”
type_host
read CMD_TYPE
if  [ $CMD_TYPE -eq  “55” ]  ; then
echo “Enter the Downtime Length (in minutes):”
read LENGTH
STARTDATE=`date +%d-%m-%Y\ %H:%M:%S`
ENDDATE=`date –date=”+$LENGTH minutes” +%d-%m-%Y\ %H:%M:%S`
curl $NAGURL -u $USER:$PASS –silent –show-error \
–data cmd_typ=$CMD_TYPE \
–data cmd_mod=$CMD_MOD \
–data host=$HOST \
–data “service=$SERVICE”  \
–data “com_data=$COMMENT” \
–data trigger=0 \
–data “start_time=$STARTDATE” \
–data “end_time=$ENDDATE” \
–data fixed=1 \
–data hours=2 \
–data minutes=0 \
–data btnSubmit=Commit | grep -q “Your command request was successfully submitted to Nagios for processing.” ;
else
STARTDATE=`date +%d-%m-%Y\ %H:%M:%S`
curl $NAGURL -u $USER:$PASS –silent –show-error \
–data cmd_typ=$CMD_TYPE \
–data cmd_mod=$CMD_MOD \
–data host=$HOST \
–data “service=$SERVICE”  \
–data “com_data=$COMMENT” \
–data trigger=0 \
–data “start_time=$STARTDATE” \
–data btnSubmit=Commit | grep -q “Your command request was successfully submitted to Nagios for processing.” ;
fi
echo Scheduled downtime for $HOST
exit
fi

if [ $6 -eq “2 ” ] ; then
echo “Enter the Service command type:”
type_svc
read CMD_TYPE
if  [ $CMD_TYPE -eq  “56” ]  || [ $CMD_TYPE -eq  “86” ]; then
echo “Enter the Downtime Length  (in minutes):”
read LENGTH
STARTDATE=`date +%d-%m-%Y\ %H:%M:%S`
ENDDATE=`date –date=”+$LENGTH minutes” +%d-%m-%Y\ %H:%M:%S`
curl $NAGURL -u $USER:$PASS –silent –show-error \
–data cmd_typ=$CMD_TYPE \
–data cmd_mod=$CMD_MOD \
–data host=$HOST \
–data “service=$SERVICE”  \
–data “com_data=$COMMENT” \
–data trigger=0 \
–data “start_time=$STARTDATE” \
–data “end_time=$ENDDATE” \
–data fixed=1 \
–data hours=2 \
–data minutes=0 \
–data btnSubmit=Commit | grep -q “Your command request was successfully submitted to Nagios for processing.” ;
else
STARTDATE=`date +%d-%m-%Y\ %H:%M:%S`
curl $NAGURL -u $USER:$PASS –silent –show-error \
–data cmd_typ=$CMD_TYPE \
–data cmd_mod=$CMD_MOD \
–data host=$HOST \
–data “service=$SERVICE”  \
–data “com_data=$COMMENT” \
–data trigger=0 \
–data “start_time=$STARTDATE” \
–data btnSubmit=Commit | grep -q “Your command request was successfully submitted to Nagios for processing.” ;
fi
echo Scheduled downtime for $SERVICE in host $HOST
exit
fi

I have tested it and it works well , but it still is limited in the functionality it provides so I am thinking of converting this to a PHP page/url that will allow the same functionality , but that will have to wait till i can find the time .

Updated VM’s

As part of my involvement in the Icinga Project , I work in the QA and VM team , and as such with the new release of 1.7.1 I have worked on upgrading the VM’s the project provides (The project officially provide a VM based on CentOS , OpenSuSe and Debian )and have provided the new RPM based VM’s (CentOS and OpenSuse) for the community to work with , evaluate and test.

The  VM’s are Virtual Box exported OVA , and can be downloaded here,

Please try them and is you find any issues , please report therm here

Announced Nagios certifications

So I logged on the site and tried the demo and to my disappointment it failed to work with my Linux Laptop , so I thought it was an issue with my system , so I contacted the test centre , I got a prompt reply but it wasn’t something i was expecting considering the exam I was planning for :

“Unfortunately our system is not compatible with Linux based operating systems at this time. We do however, offer support with Windows and Mac computers.”

So , when trying to test a Linux based application you are not supporting access from a Linux OS ? that seemed very odd to me so I approached  Nagios.com for clarification , and this was the answer I got:

“You are correct, at this time ProctorU does not support Linux OS’. I understand how that may seem odd, and apologize for any inconvenience this may cause you.

However, we spent a great deal of time selecting our certification proctoring partner, and eventually determined that ProctorU was able to offer the greatest overall value to our clients. Unfortunately one of the few downsides is that they do not support Linux OS’ ?

Hopefully you are able to get ahold of a Windows machine to take the certification on.”

So in essence I need to bend over backwards in order to pay money and take an exam , And work with an OS I despise ? Is it me or this sounds like a bad business planning ?